
Mississippi Commercial Oyster Industry
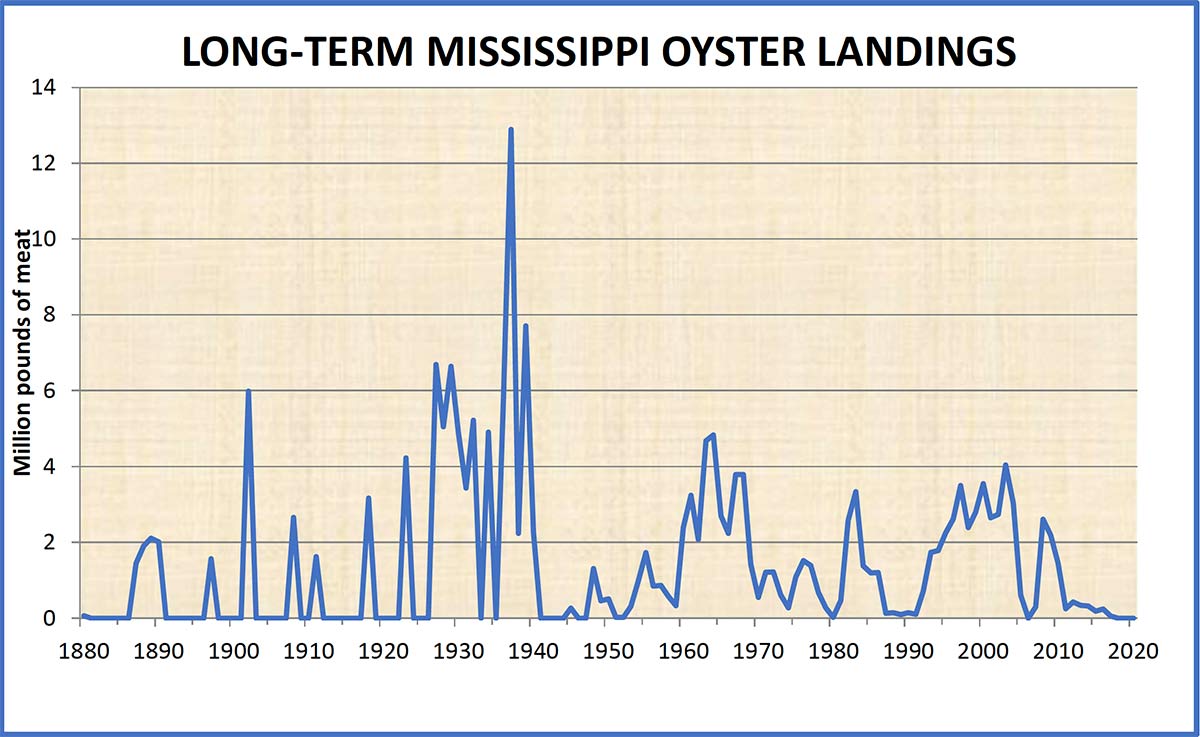
The annual Mississippi commercial Eastern oyster landings (in million pounds) since 1980 are shown below. There were a lot of years between 1880 and 1948 when data on annual landings were not available. The data from 1880 to 1949 were retrieved from the available copies of the annual reports published by NOAA Fisheries. The data from 1950 to 2018 were compiled from the NOAA Fisheries website.
In response to requests by state regulatory agencies and seafood organizations, the 2009 (and later) economic contributions of the Mississippi seafood industry by major species were imputed from state estimates published by NOAA Fisheries. Extension and research publications were developed to document the economic contributions of the major seafood species landed, processed, sold, and consumed in Mississippi.
Sales are the gross sales by businesses within the economic region affected by an activity. Sales, income, value-added, and tax contributions are measured in dollars. Employment or job contribution is expressed in terms of a mix of both full-time and part-time jobs. The total economic contribution is the sum of direct, indirect, and induced contributions.
The economic contributions of the oyster industry in 2009 are shown in the table below. The sales contributions reached $23.72 million in 2009 and generated 562 full-time and part-time jobs. Income contribution was $9.0 million, and value-added created was $11.9 million. The industry added tax impacts reaching $1.15 million.
| 2009 Economic Impacts of Mississippi Oyster Industry By Sector Without Imports | |||||
|---|---|---|---|---|---|
| Sector | Sales impacts (M$) | Job impacts | Income impacts (M$) | Value-added impacts (M$) | Indirect tax impacts (M$) |
| Harvesting | 9.77 | 199 | 3.02 | 4.38 | 0.30 |
| Processing | 2.62 | 35 | 1.04 | 1.30 | 0.05 |
| Wholesaling | 1.58 | 17 | 0.56 | 0.70 | 0.21 |
| Fish Markets | 0.83 | 20 | 0.41 | 0.50 | 0.12 |
| Restaurants | 8.92 | 292 | 3.97 | 5.02 | 0.48 |
| Total | 23.72 | 562 | 9.00 | 11.90 | 1.15 |
Table 1 shows estimates of the 2009 economic contributions of the Mississippi oyster industry from MAFES Bulletin 1209.
The economic impacts of the Mississippi oyster industry in 2011 are shown in the table below. The sales impacts of the industry reached more than $13 million in 2011 and created about 354 full-time and part-time jobs in the same year. Income contribution was $5.62 million, and value-added created was $7.18 million. The industry added tax impacts reaching $1.32 million.
| 2011 Economic Impacts of Mississippi Oyster Industry By Sector Without Imports | |||||
|---|---|---|---|---|---|
| Sector | Sales impacts (M$) | Job impacts | Income impacts (M$) | Value-added impacts (M$) | Tax impacts (M$) |
| Harvesting | 1.51 | 30 | 0.45 | 0.67 | 0.07 |
| Processing | 1.91 | 25 | 0.75 | 0.95 | 0.07 |
| Wholesaling | 1.03 | 11 | 0.37 | 0.46 | 0.11 |
| Fish Markets | 0.68 | 16 | 0.34 | 0.41 | 0.11 |
| Restaurants | 8.34 | 272 | 3.71 | 4.69 | 0.95 |
| Total | 13.47 | 354 | 5.62 | 7.18 | 1.32 |
Table 2 shows estimates of the 2011 economic contributions of the Mississippi crab industry from https://coastal.msstate.edu/oyster-economic-impact.
Updated 2015 estimates of the economic contributions of the combined crab and oyster industries in Mississippi are shown below. Due to the confidentiality of the 2015 data, NOAA Fisheries estimates were combined for the two sectors. The combined sales contributions totaled $35 million and generated 831 full-time and part-time jobs. Pooled-income contributions were $14.8 million, and value-added created was $18.9 million.
| Economic contributions of Mississippi oyster and crab industry by sector and type, 2015 | |||||
|---|---|---|---|---|---|
| Sector |
Sales contributions (M$) |
Job contributions | Income contributions (M$) | Value-added contributions (M$) | |
| Commercial harvesters | 3.4 | 63 | 1.1 | 1.5 | |
| Seafood processors & dealers | 4.0 | 48 | 1.6 | 2.0 | |
| Seafood importers | 0.0 | 0 | 0.0 | 0.0 | |
| Seafood wholesalers & distributors | 3.2 | 31 | 1.1 | 1.4 | |
| Seafood retailing | 24.4 | 689 | 11.1 | 13.9 | |
| Total | 35.0 | 831 | 14.8 | 18.9 | |
Table 3 shows the combined estimates of the 2015 economic contributions of the Mississippi crab and oyster sectors from Extension publication 3194.
MISSISSIPPI MARKETMAKER
- Dockside and Wholesale Prices of Oysters
Commercial Oyster Harvesting - Commercial Eastern Oyster Fishing in the Gulf of Mexico States
- Mississippi Oyster Season to Open in October
- Know Your Local Seafood Business Handling Oyster Products!
- Economic Contributions of the MS Seafood Industry by Major Species in 2015